I always like Jason Kottke’s end-of-year books recommendations. His list for this year has a few that I’ve read, a few I have wanted to read, and several that weren’t (yet) on my list.

Holiday tech support operations resume this year with setting up Dad’s 2009 MacBook Pro to migrate to my year-old model. Look at the ports on that thing!
Made one more small adjustment this morning to tuneR, adding a date range selector to limit the query. It’s fun to see how my top artists change when adjusting that window.

Up early with my coffee and the tree.
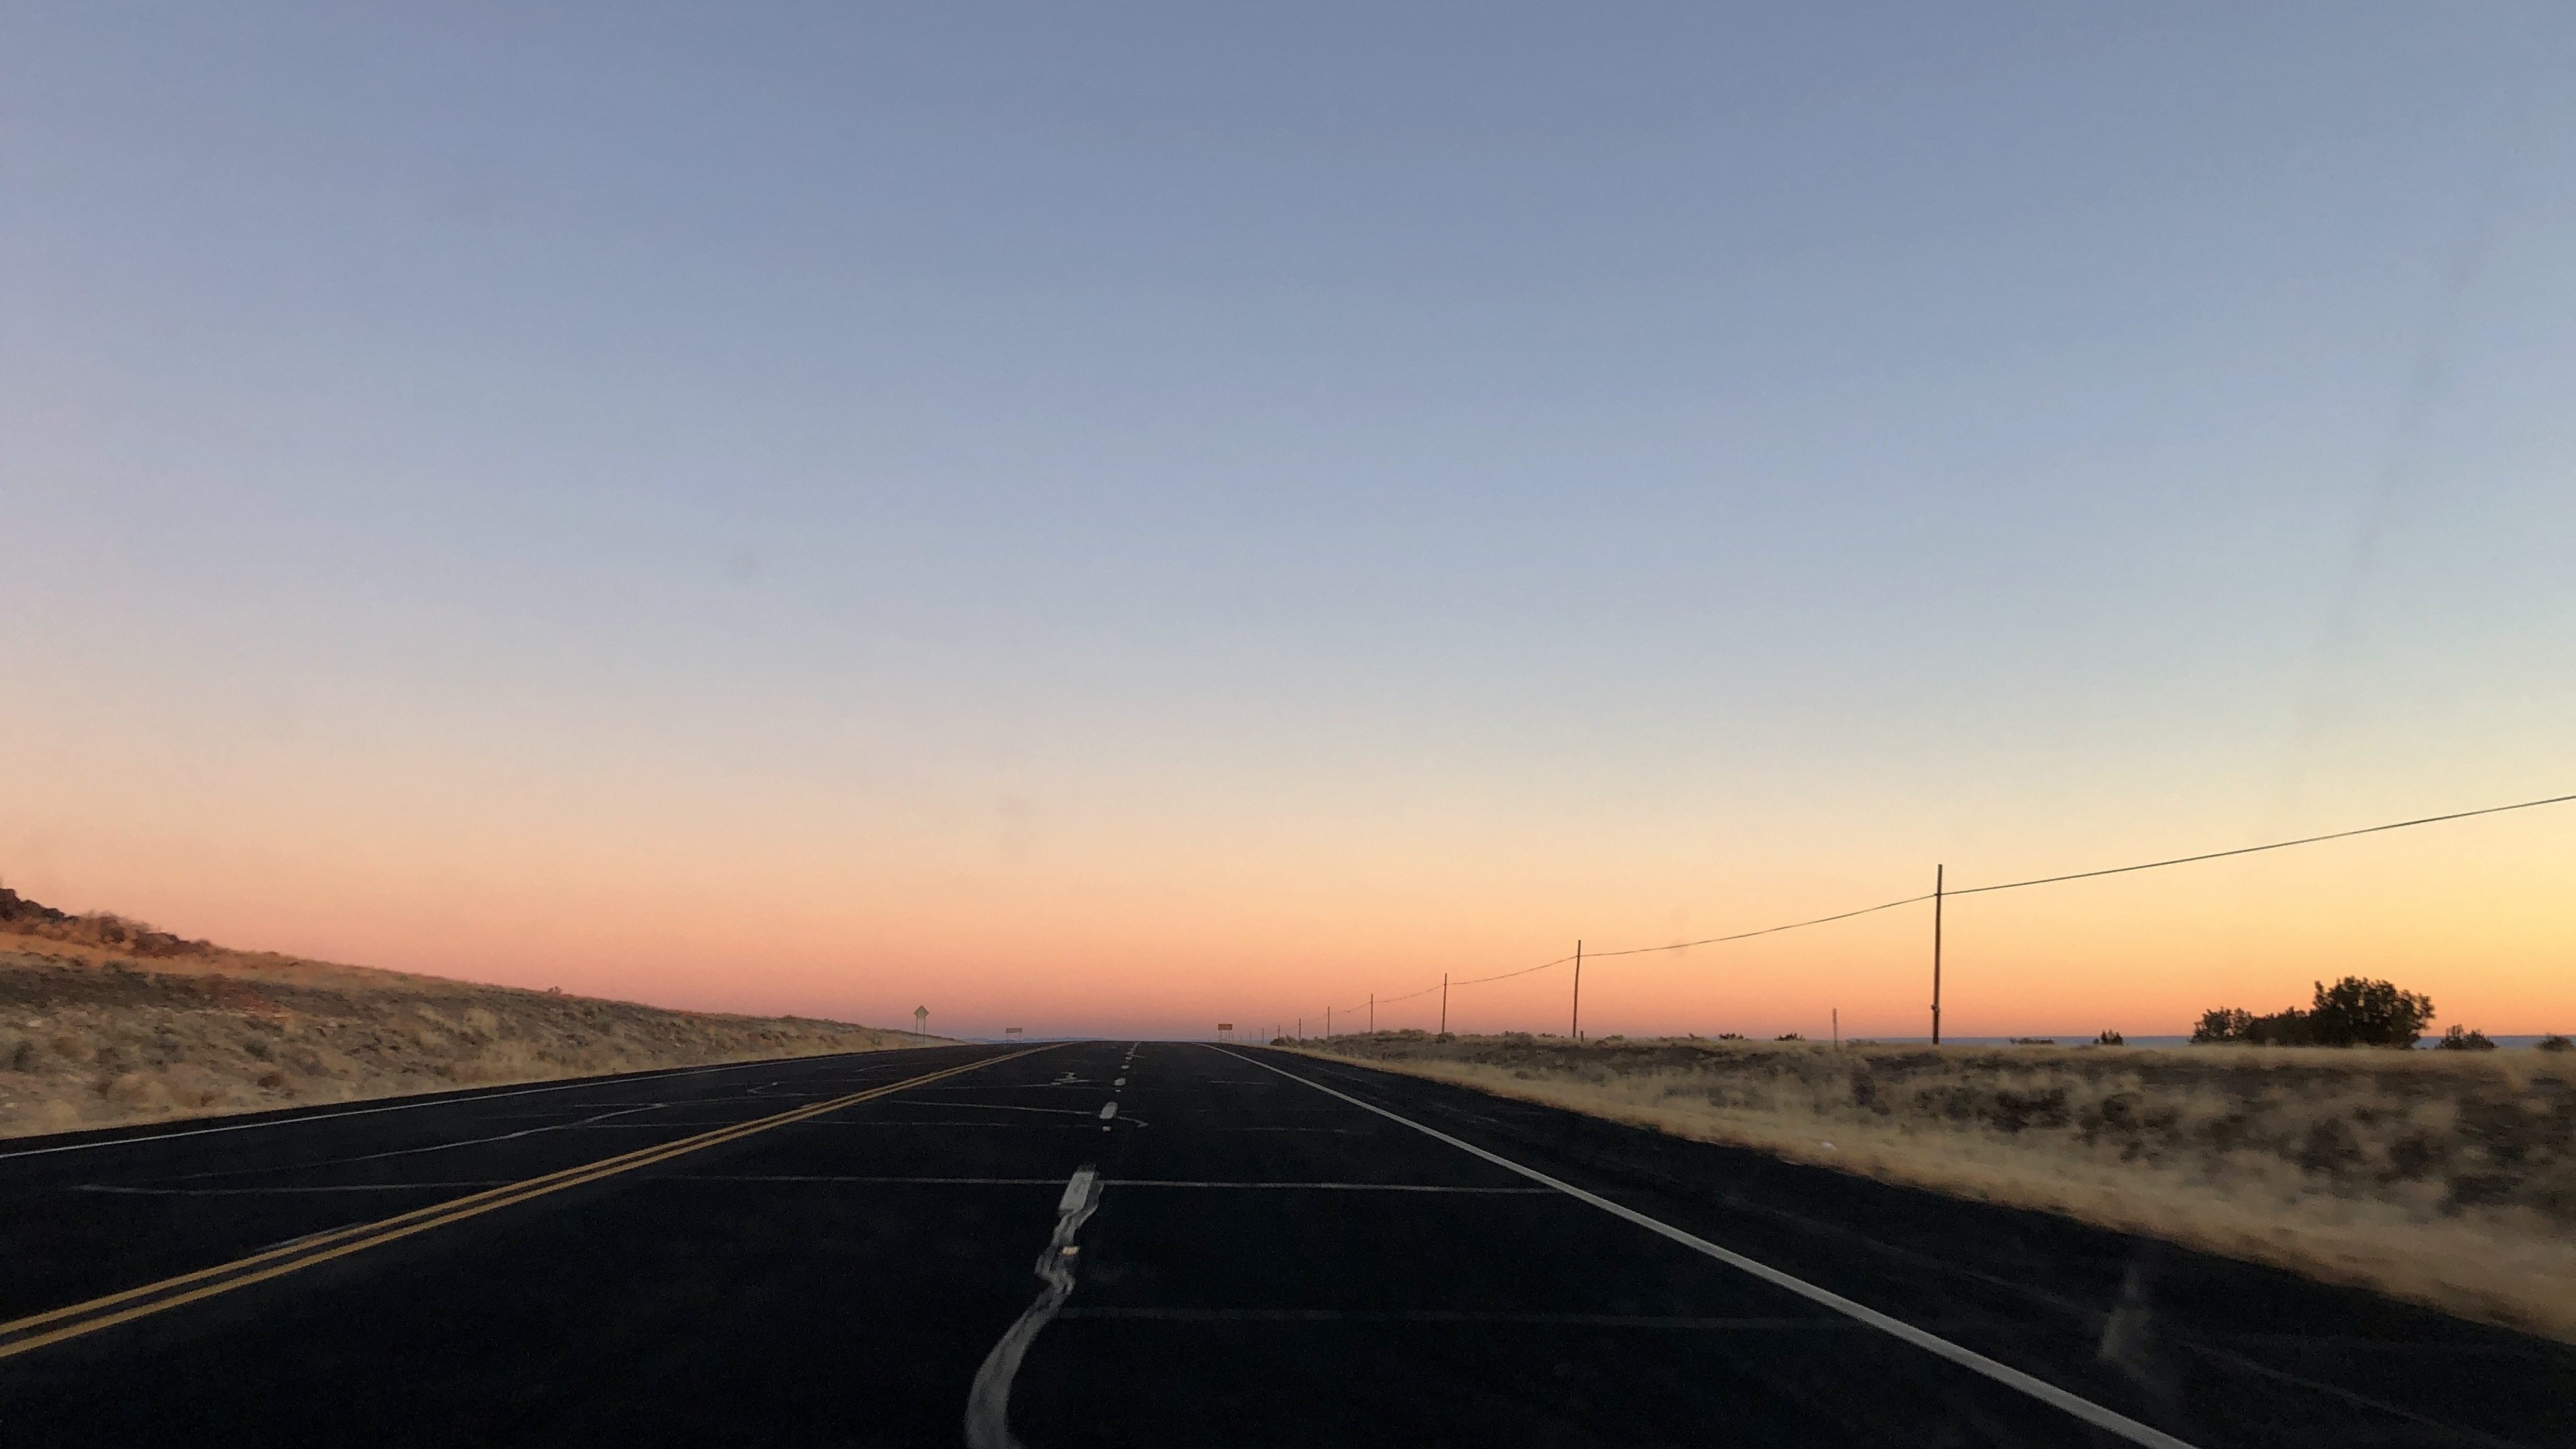
Drove eleven hours today. Pretty good trip. How’s everybody doing?
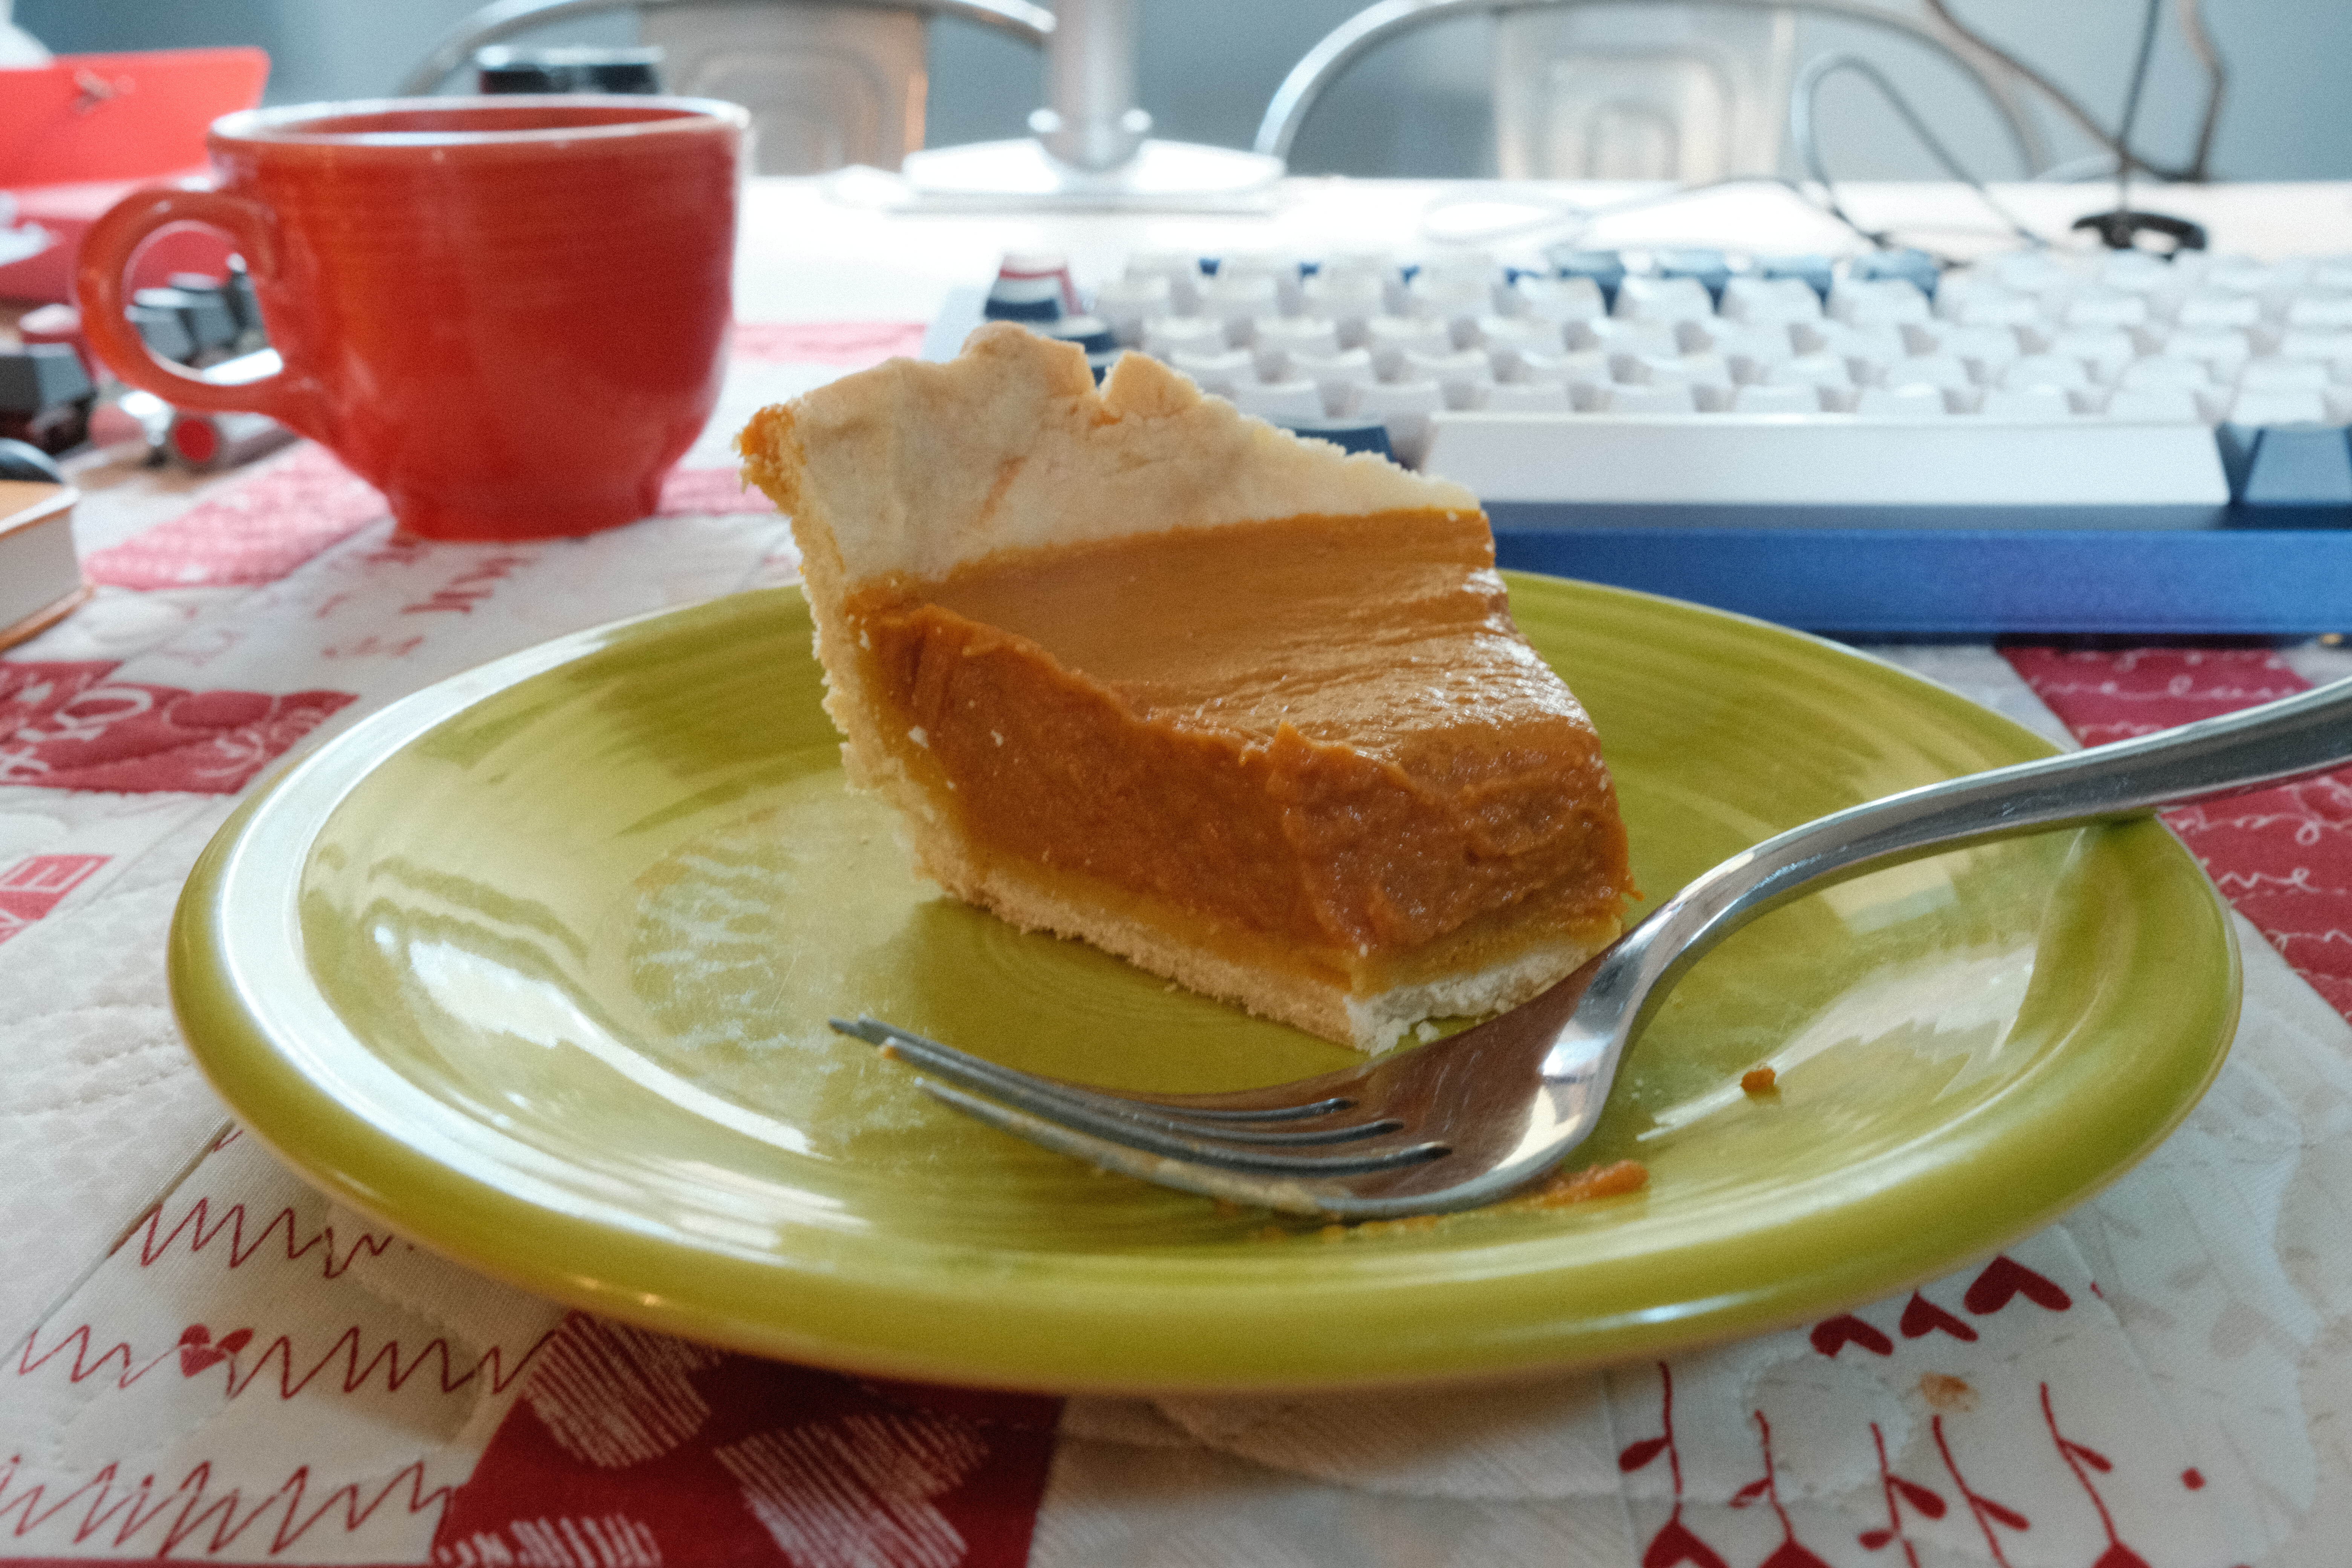
Desktop and pumpkin pie
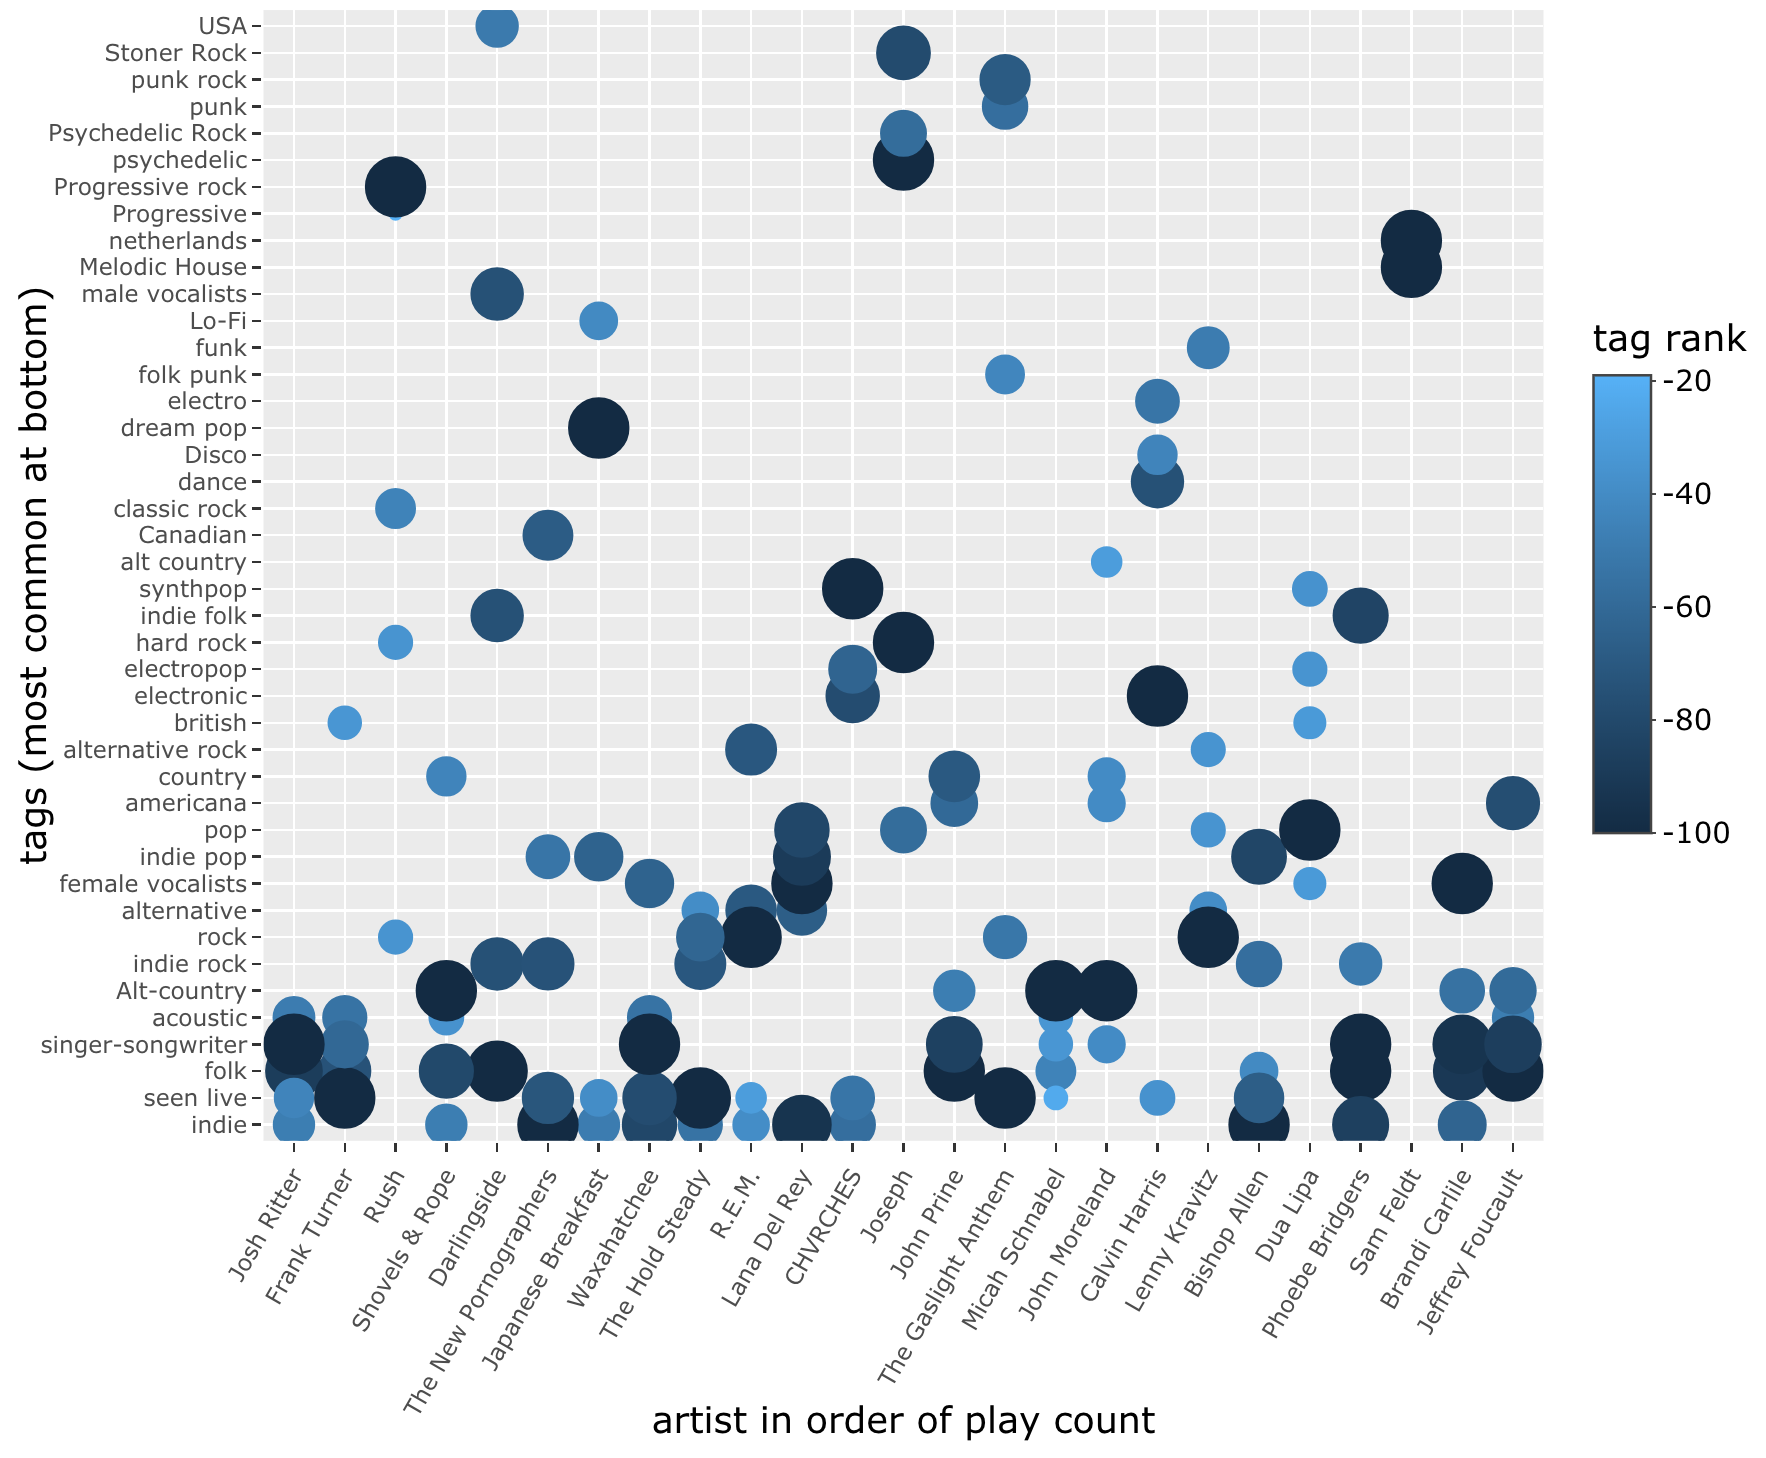
Okay, one final (probably) revision of tuneR for today, adding a bit of color and sizing to the plot of tags by artist, to show variation in tag rank within each artist.
What I’d give for a fish shell-style approach to command history in the R console.
A lot. I’d give a lot.
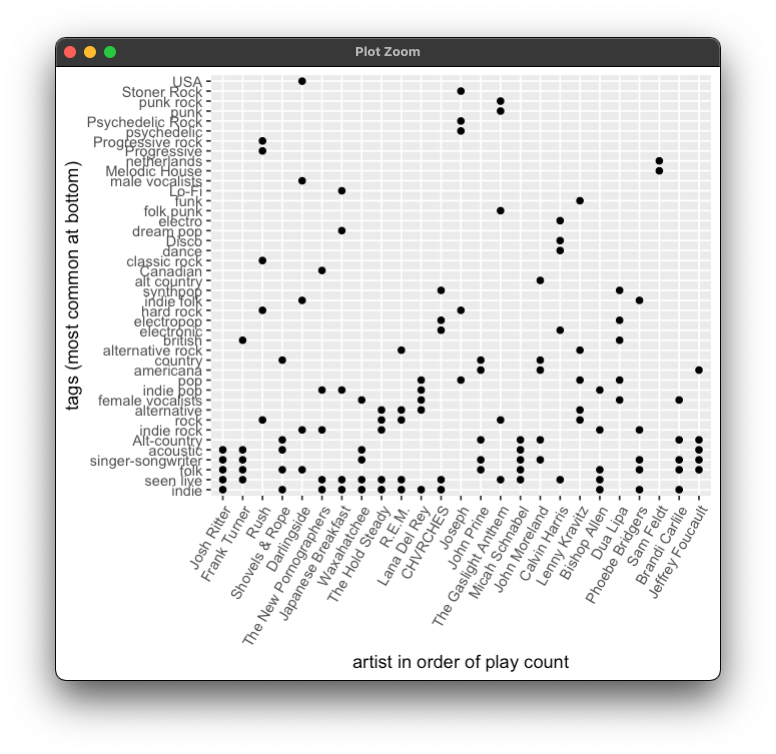
Today’s small revision of tuneR adds a scrollable table of user-assigned tags to your artists, and a plot of artists by tag sorted to show the most used tags across your top 25 artists this year. Coming soon – possibly some track-level data!
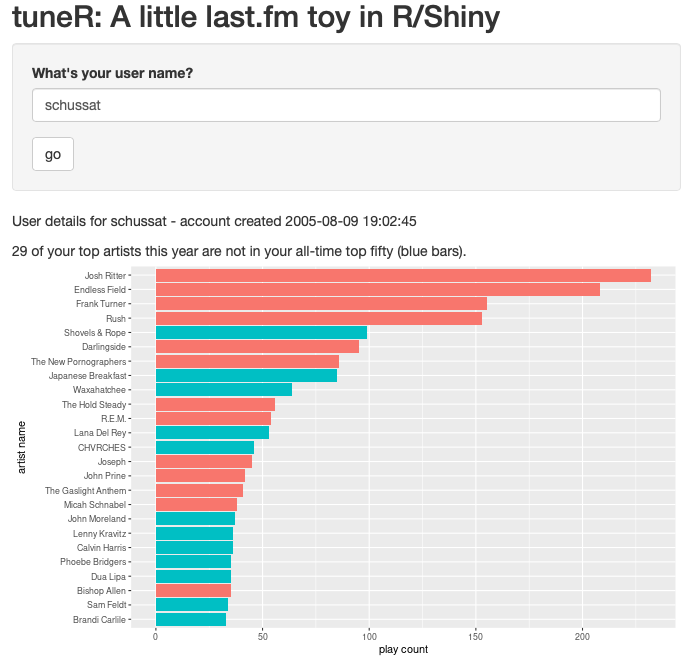
Inspired by all the enthusiasm for Spotify’s end-of-year Wrapped summaries, tuneR is my extremely rudimentary first start at my own version, done in R/Shiny. I’d love to hear if it works for you and what else would make it more fun!